Introduction
In the last three decades, the United States has experienced significant demographic transformations characterized by an aging population and rising levels of educational attainment. This study delves into the relationship between these two pivotal trends and their collective impact on fertility rates from 1990 to 2020. By utilizing data from the United Nations and the World Bank, the research examines how the rate of population aging and the increasing educational achievements within the society have influenced fertility decisions. The investigation addresses a critical gap in understanding the dual influence of demographic aging and educational elevation on fertility dynamics.
Our estimand is the effect of the aging population rate and educational attainment on fertility rates in the United States from 1990 to 2020. We seek to quantify how shifts in the demographic composition, particularly the proportion within the working-age bracket, alongside rising levels of education, impact the number of children born per woman. This focus is pivotal to our analysis, enabling us to elucidate the interplay between demographic aging, educational progress, and fertility trends.
We find a distinct inverse relationship between the fertility rate and educational attainment: as the average level of education rises, fertility rates tend to decline. This trend suggests that higher education may contribute to delayed family planning and a reduction in the number of children per family. Additionally, this paper reveals that the increase in the working-age population percentage is positively associated with higher fertility rates. This correlation implies that, conversely, an aging population tends to have a negative impact on fertility rates.
This paper advocates for targeted policy interventions to mitigate the potential socioeconomic challenges posed by these trends. Recommendations include the development of policies that support work-life balance, enabling individuals to pursue higher education and career goals without forgoing family aspirations. Furthermore, the paper underscores the necessity for social policies that address the needs of an aging population, ensuring sustainable demographic and economic growth.
The paper is organized into sections covering Data, Model, Results, and Discussion. The Data section outlines our datasets, including data selection, cleaning, and the challenges encountered. The Model section introduces our linear regression analysis, detailing the construction and justification of the model used to examine the impact of the aging population rate and educational attainment on fertility rates. In the Results section, we highlight our finding of the positive impact of the working-age population percentage on fertility rates and the inverse relationship between educational attainment and fertility. Finally, the Discussion section considers the existing body of research, interpreting the implications of these trends and suggesting avenues for future investigations that further explore these complex relationships.
Data
This section provides an overview and analysis of datasets concerning the United States from 1990 to 2020, focusing on age distribution, education achievements and fertility rate. Sourced from the United Nations, Department of Economic and Social Affairs, Population Division (2022) and World Bank (2023), these datasets have then been processed by Our World in Data to ensure accuracy, comparability, and relevancy.
Data Source
The datasets utilized in this analysis are sourced from the United Nations for age distribution and fertility rates, and the World Bank for tertiary education enrollment rates. Specifically, demographic data are courtesy of the United Nations, Department of Economic and Social Affairs, Population Division (2022), while education and economic data are extracted from the World Bank (2023), respectively. These sources provide a reliable and authoritative foundation for examining changes in the United States over 1990 to 2020.
Data Cleaning and Processing
The initial data processing is conducted by Our World in Data (2024), a project committed to making comprehensive datasets understandable and widely accessible. Our World in Data (2024) had already undertaken extensive work to standardize this data for global comparability, calculate derived metrics such as per capita figures, and ensure the coherence of metadata across a variety of data types.
After Our World in Data (2024)’s processing, we further processed the
data using R programming (R Core Team 2023). This involved reading raw
data files into data frames, filtering the datasets to include only the
United States from 1990 to 2020 using functions from dplyr packages
(Wickham et al. 2023). Additionally, we used ggplot2 to create visual
representations of these trends (Wickham 2016).
Measurement
The datasets were collected and measured using authoritative sources, primarily the United Nations and the World Bank. The United Nations Department of Economic and Social Affairs Population Division offers detailed demographic data, including age distribution and fertility rates, through regular population surveys and censuses conducted in member countries. Similarly, the World Bank compiles education and economic indicators, such as tertiary education enrollment rates, from official national and international statistical sources. This data collection and measurement process involves data cleaning, validation, and standardization efforts to facilitate global comparability and to address discrepancies in data reporting standards across countries.
Variables of Interest
Age Distribution
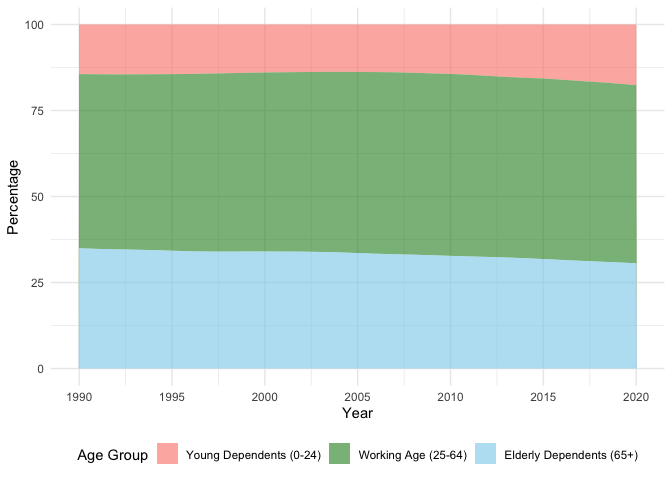
The age distribution dataset, as illustrated by Figure 1, outlines the population distribution across three age groups in the United States from 1990 to 2020. It categorizes the population into Young Dependents (age 0 - 24), Working Age (age 25-64), and Elderly Dependents (age 65+), providing specific counts for each group alongside the total population and the percentage share of each category per year.
We observed a gradual increase in the percentage of Elderly Dependents from 14.4% in 1990 to 17.6% in 2020, indicating an aging population. Conversely, the proportion of Young Dependents has decreased from 35.0% to 30.6% in the same period, reflecting potential shifts in birth rates and family planning trends. The Working Age group has seen slight fluctuations but generally maintained a steady share of the population, peaking at 52.9% in multiple years before slightly decreasing to 51.8% by 2020. This dataset highlights significant demographic trends, including an aging society and changes in the workforce’s size relative to dependents.
Education Achievements
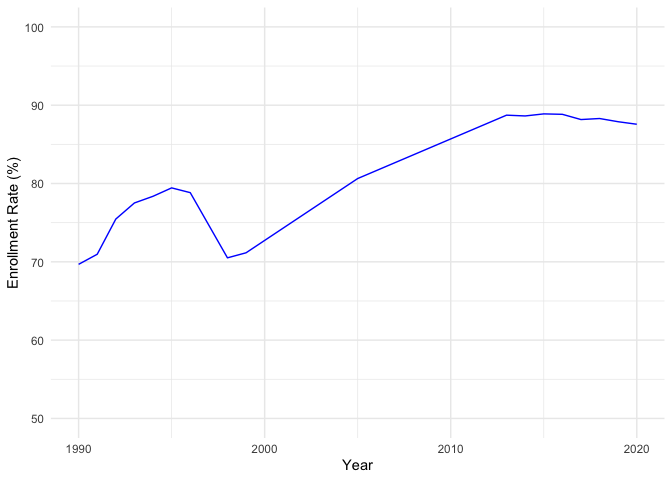
The education achievements dataset, visualized by the Figure 2, presents the gross tertiary education enrollment rate in the United States from 1990 to 2020. The gross tertiary education enrollment rate is the percentage of the population in the five-year age group following secondary school who are enrolled in tertiary education, regardless of age. This dataset does not directly represent the educational attainment of the entire population, as it only accounts for those currently enrolled in tertiary education within a specific age group. Nevertheless, it can serve as an indicator of the overall educational levels in a country, providing insights into the accessibility and participation rates in higher education.
Notably, the data reveals a general upward trend in enrollment rates, starting from 70% in 1990 and peaking at 89% in 2015, before slightly declining to 88% by 2020. The dataset highlights significant growth in tertiary education participation, reflecting an increasing value placed on higher education in the U.S. over the period analyzed. Moreover, there is a noticeable dip in enrollment rate to 71% in 1998, following a period of steady increases. This decline is an anomaly within an otherwise consistent upward trajectory. Following this dip, the rates resumed their increase, suggesting a temporary setback rather than a long-term trend. The data underscores the fluctuating yet overall positive trajectory of tertiary education enrollment in the U.S., emphasizing the nation’s emphasis on higher education as a key component of societal progress.
Fertility Rate
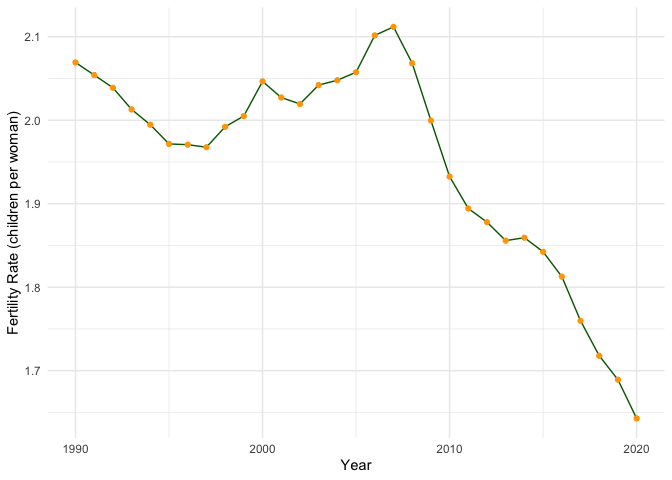
From Figure 3, we can see that this dataset charts the fertility rate trend in the United States from 1990 to 2020, showing the average number of children born per woman during this period. The initial rate in 1990 stood at 2.07 children per woman, experiencing slight fluctuations through the decades, peaking at 2.10 in 2007, and then demonstrating a notable decline to 1.60 by 2020. This progression indicates a significant shift in family planning and societal trends, with the fertility rate decreasing below the replacement level of approximately 2.10 children per woman, which is generally considered necessary to maintain a stable population level.
An interesting observation from the dataset is the steady decline in fertility rates post-2007, coinciding with the global financial crisis, suggesting potential economic influences on family planning decisions. The decline becomes more pronounced in the last decade, highlighting a trend towards smaller family sizes in the U.S. This data not only reflects changes in societal norms and economic conditions but also underscores potential long-term demographic shifts, with implications for policy, social services, and economic planning.
Model
In this section, we constructed a linear regression model aimed at revealing the relationship between fertility rates and two independent factors: the working age population percentage and tertiary education enrollment rate in the United States from 1990 to 2020. The subsequent paragraphs will outline the setup of our model, including the selection of variables and the statistical methods employed, followed by a justification for choosing linear regression as the analytical framework to examine these dynamics.
Model Setup
The linear regression model we propose is designed to quantify how the working age population percentage and the tertiary education enrollment rate impact the fertility rate. The model is structured as follows:
Y = β0 + β1X1 + β2X2 + ϵ
where:
- Y represents the Fertility Rate, our dependent variable.
- X1 is the Working Age Population Percentage.
- X2 is the Tertiary Education Enrollment Rate.
- β0 is the intercept of the model, indicating the expected value of Y when X1 = X2 = 0.
- β1 and β2 are the coefficients for X1 and X2 respectively, indicating the expected change in Y for a one-unit increase in X1 or X2, keeping the other variable constant.
- ϵ represents the error term, capturing the deviation of the predicted values from the actual values.
The independent variables of the model are the Working Age Population Percentage (X1) and the Tertiary Education Enrollment Rate (X2), while the dependent variable is the Fertility Rate (Y), reflecting the average number of children born per woman.
Model justification
Choosing linear regression for our analysis is based on a hypothesis that both the percentage of the working-age population and the tertiary education enrollment rate have linear relationships with the fertility rate. The datasets on fertility trends, tertiary education enrollment, and age distribution in the United States from 1990 to 2020 suggest potential correlations. As the working-age population ratio decreases, a corresponding decline in the fertility rate is observed, suggesting a potential positive linear correlation. Conversely, within the same time frame, the tertiary education enrollment rate moves in the opposite direction compared to the fertility rate, indicating a negative linear correlation. Because of the hypothesis that there are linear relationships between dependent and independent variables, linear regression model is a suitable choice due to its simplicity and efficacy in revealing direct relationships and its capacity for prediction.
The model’s output reinforces its suitability. The significant p-value for the tertiary education enrollment rate (p < 0.001) indicates a robust inverse relationship with the fertility rate, aligning with expectations that higher education levels could lead to lower fertility rates due to factors like career prioritization and delayed family planning. The working age population percentage, while not statistically significant, offers valuable insights into demographic shifts’ potential impacts. The model’s high R2 value (70.05%) further justifies linear regression, suggesting that a significant portion of the variance in fertility rates is explained by these variables. Additionally, the Variance Inflation Factor (VIF) values below 5 indicate minimal multicollinearity, affirming the model’s reliability.
Results
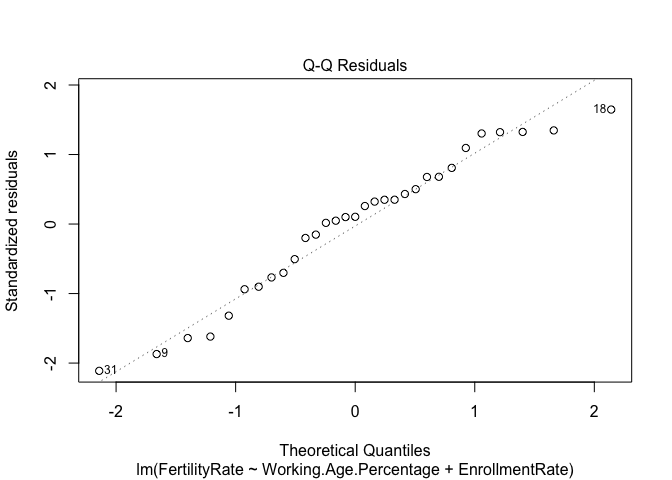
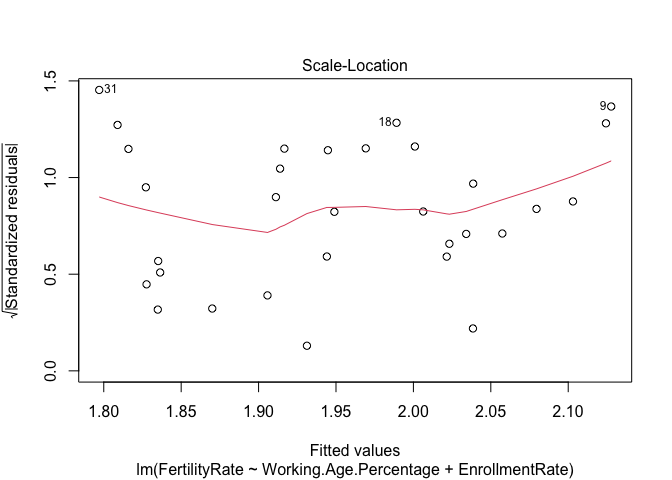
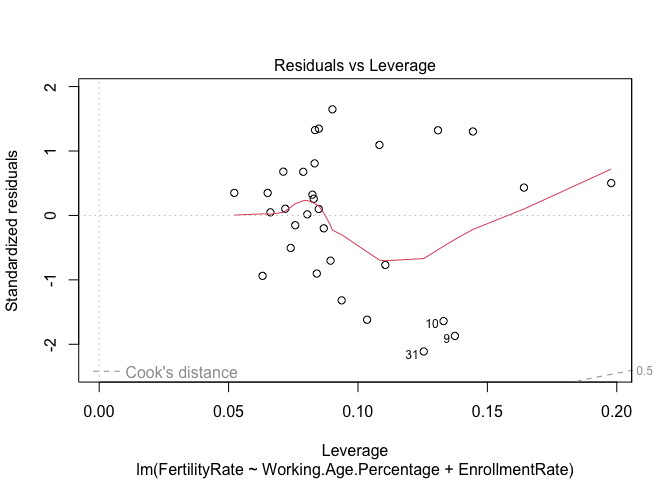
This section presents the outcomes of the linear regression model, offering insights into the relationship between fertility rates and our predictors: the working age population percentage and the tertiary education enrollment rate. We’ll explore the model’s coefficients, assess its assumptions through diagnostic plots, and examine potential multicollinearity among predictors.
Model Analysis
Model Summary
| Est. | S.E. | t val. | p | |
|---|---|---|---|---|
| (Intercept) | -1.16 | 1.25 | -0.93 | 0.36 |
| Working.Age.Percentage | 0.09 | 0.03 | 3.40 | 0.00 |
| EnrollmentRate | -0.02 | 0.00 | -6.93 | 0.00 |
| Standard errors: OLS |
Summary Analysis
From the above model summary, we can see that the linear regression model demonstrates a significant fit to the data across 31 observations. With an F-statistic of 24.42 and a p-value less than 0.01, the model significantly explains variations in the fertility rate, indicating that the independent variables collectively have a meaningful impact. The model accounts for 64% of the variance in fertility rates (R² = 0.64), with an adjusted R² of 0.61, adjusting for the number of predictors, thus confirming a good fit and the model’s explanatory power.
Examining the coefficients, the working age population percentage shows a positive impact on the fertility rate (Est. = 0.09, p < 0.01), suggesting that as the proportion of the working-age population increases, so does the fertility rate. Conversely, the tertiary education enrollment rate negatively influences the fertility rate (Est. = -0.02, p < 0.01), indicating that higher enrollment rates are associated with lower fertility rates. These findings align with theoretical expectations, underscoring the significant and inverse relationship between education levels and fertility, while also highlighting the positive correlation between the size of the working-age population and fertility.
Discussion
The Influence of Educational Attainment on Fertility Decisions
According to the Model Analysis section, we can see that higher educational attainment shows a positive impact on the fertility rate. Wineberg (1988) analyzed the United States Current Population Survey and highlighted that education influences the timing of fertility, particularly the timing of the first three births among once-married white women. This relationship has remained relatively stable over time, indicating that higher education levels lead to later family formation and smaller family sizes due to prioritization of career and personal development goals.
The shift towards delayed childbearing among highly educated women aligns with broader societal changes and individual aspirations for career development before starting a family. Kravdal and Rindfuss (2008) observed a significant decrease in the negative relationship between completed fertility and educational level over time, particularly among women. This change suggests an evolving landscape where family-friendly policies and the increased availability of quality daycare have mitigated the adverse effects of higher education on fertility.
Furthermore, the convergence of childlessness rates between educational subgroups in the United States reflects changing norms and realities. Rybińska (2020) found that childlessness rates are declining among women with tertiary education, indicating a shift towards achieving both educational and family goals. This trend suggests a closing gap in childlessness across educational subgroups, driven by a combination of societal, economic, and policy changes that support family formation alongside educational attainment.
Lastly, the role of education in shaping fertility desires and expectations cannot be overlooked. Verweij et al. (2019) emphasized that higher educated and working women do not necessarily desire to remain childless. Instead, constraints related to education and occupation lead to postponement of childbearing, challenging the notion that higher education directly correlates with a desire for childlessness. This insight calls for a reevaluation of how educational opportunities and career aspirations impact fertility decisions and the importance of supportive policies to help women realize their fertility desires.
In conclusion, the influence of educational attainment on fertility decisions encapsulates a multifaceted interaction between individual choices, societal norms, and policy environments. As education continues to play a pivotal role in shaping life trajectories, understanding its impact on fertility provides crucial insights for policymakers, educators, and society at large.
Socio-Demographic Shifts: Implications for Policy and Society
The aging population and its impact on the workforce and social services are significant concerns. Lutz and Goujon (2001) highlighted the momentum in demographic shifts due to historical fertility trends. In the United States, the aging of the baby boomer generation and below-replacement fertility rates among native-born populations are reshaping the demographic structure, emphasizing the need for policies that address the challenges of an aging workforce and social security sustainability.
The educational attainment spectrum’s expansion poses both challenges and opportunities for the economy. Zajacova, Hummer, and Rogers (2012) detailed the health differentials across educational levels among U.S. working-age adults, revealing stark disparities. These findings suggest that as the educational landscape diversifies, so too does the need for health policies that address these disparities and support the well-being of all educational subgroups, thus contributing to a more productive and healthy workforce.
The decline in fertility rates and its implications for future population growth are also of concern. Beaujouan and Berghammer (2019) examined the gap between lifetime fertility intentions and completed fertility, finding that women often have fewer children than they intend. This gap, influenced by socio-economic factors and policy environments, calls for a reevaluation of family support policies to better align with contemporary fertility behaviors and aspirations, ensuring sustainable population growth.
Finally, the changing dynamics of education and labor participation among women highlight the evolving role of women in the economy. McClamroch (1996) studied the relationships between total fertility rate, women’s education, and labor participation, suggesting that as women attain higher education levels and participate more in the workforce, fertility patterns shift. This underscores the importance of policies that support work-family balance, enabling women to fulfill both career and family aspirations without compromising on either front.
Weaknesses and next steps
The analysis presented in this paper reveals that the linear regression model has its limitations. According to the Model Diagnostics section, the model’s residuals versus fitted values figure do not scatter perfectly around the zero line, suggesting that the linear relationship does not fully capture the complexity of these interactions. This discrepancy points to potential weaknesses in the model’s ability to account for the nuanced and multifaceted nature of fertility decisions, highlighting the need for further refinement.
To address the identified weaknesses, future research should consider exploring alternative statistical frameworks beyond linear regression. Such approaches could include non-linear models or machine learning techniques that can accommodate more complex relationships and interactions between variables. Additionally, incorporating a broader set of variables, such as socio-economic factors, cultural influences, and individual preferences, may provide a more comprehensive understanding of fertility behaviors. Expanding the model in these ways will not only improve its analytical capacity but also offer richer insights into the dynamics of fertility decision-making.
Appendix
Model Diagnostics
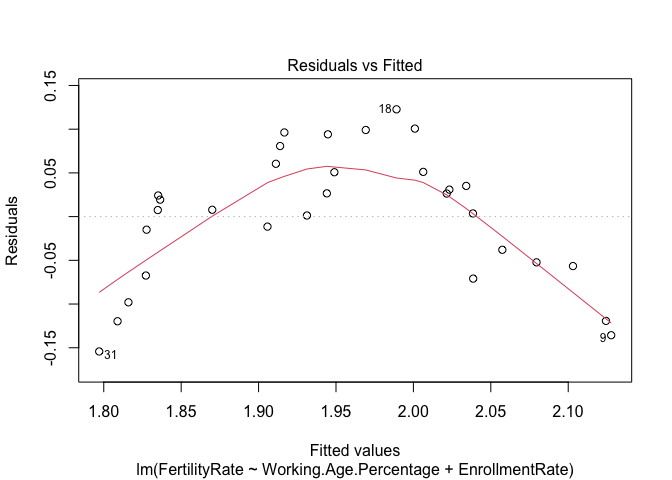
Figure 4: Model Diagnostic Figures
References
Beaujouan, Éva, and Caroline Berghammer. 2019. “The Gap Between Lifetime Fertility Intentions and Completed Fertility in Europe and the United States: A Cohort Approach.” Population Research and Policy Review, 1–29.
Kravdal, Ø., and R. Rindfuss. 2008. “Changing Relationships Between Education and Fertility: A Study of Women and Men Born 1940 to 1964.” American Sociological Review 73: 854–73.
Lutz, Wolfgang, and Anne Goujon. 2001. “The World’s Changing Human Capital Stock: Multi‐state Population Projections by Educational Attainment.” Population and Development Review 27: 323–39.
McClamroch, Kristin. 1996. “Total Fertility Rate, Women’s Education, and Women’s Work: What Are the Relationships?” Population and Environment 18: 175–86.
Our World in Data. 2024. “Our World in Data.” Our World in Data.
R Core Team. 2023. R: A Language and Environment for Statistical Computing. Vienna, Austria: R Foundation for Statistical Computing.
Rybińska, A. 2020. “A Research Note on the Convergence of Childlessness Rates Between Women with Secondary and Tertiary Education in the United States.” European Journal of Population 36: 827–39.
United Nations, Department of Economic and Social Affairs, Population Division. 2022. “World Population Prospects 2022, Online Edition.”.
Verweij, Renske M., Gert Stulp, H. Snieder, and M. Mills. 2019. “Can Fertility Desires and Expectations Explain the Association of Education and Occupation with Childlessness?”
Wickham, Hadley. 2016. Ggplot2: Elegant Graphics for Data Analysis. Springer-Verlag New York..
Wickham, Hadley, Romain François, Lionel Henry, Kirill Müller, and Davis Vaughan. 2023. Dplyr: A Grammar of Data Manipulation.
Wineberg, H. 1988. “Education, Age at First Birth, and the Timing of Fertility in the United States: Recent Trends.” Journal of Biosocial Science 20: 157–65.
World Bank. 2023. “World Bank Education Statistics (EdStats).”.
Zajacova, Anna, Robert Hummer, and Richard G. Rogers. 2012. “Education and Health among U.S. Working-Age Adults: A Detailed Portrait across the Full Educational Attainment Spectrum.” Biodemography and Social Biology 58: 40–61.
